
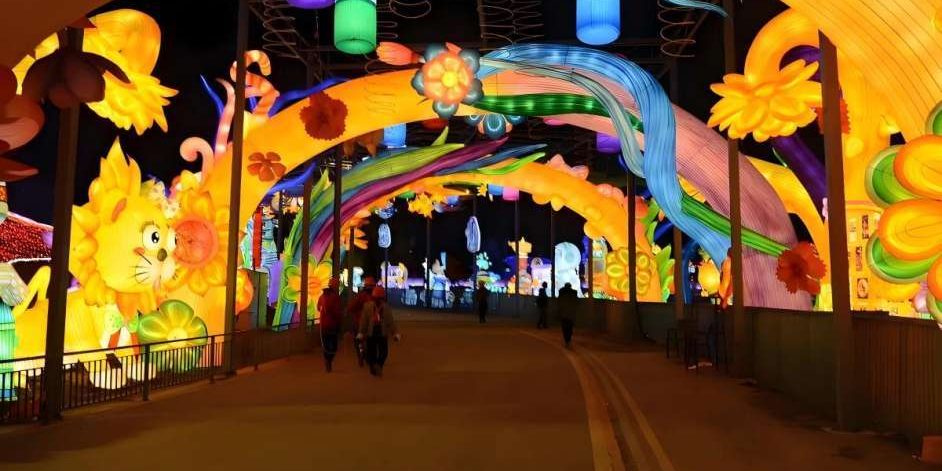
Why One Landmark Piece Decides Whether Your Night Trail Works
Every night trail gets planned the same way. Someone walks the site, measures the path, divides the budget by the metre, and specifies an installation every fifty or eighty metres so that no stretch feels empty. It is a defensible approach, and it is why so many trails feel like the same trail.
The attendance data from the world’s largest light festivals suggests the budgeting logic is inverted. Value in a night trail does not distribute evenly across distance. It concentrates — sharply — around a very small number of pieces, and everything between them exists mostly to slow people down on the way to the next one.
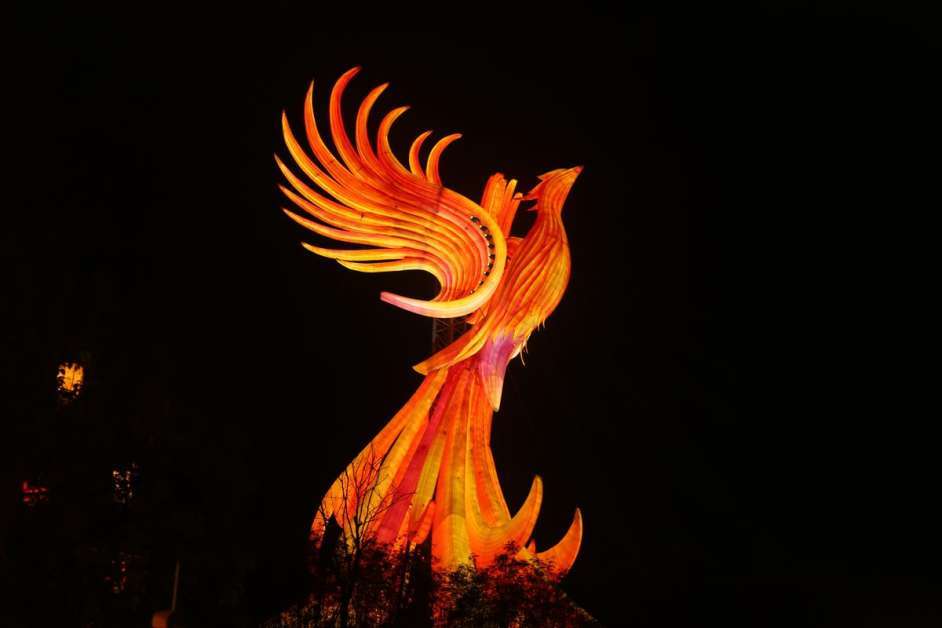
The scale of what’s at stake
The commercial case for after-dark programming is no longer speculative. London’s nightlife economy — the leisure, culture and entertainment subset of everything that happens between 6pm and 6am — generates £21 billion a year, equivalent to 5.6% of the entire UK economy, and supports 1.32 million night workers. The broader London night-time economy contributes £139 billion annually. Demand is not the constraint: 82% of Londoners aged 25–44 go out at least once a month after dark.
That demand is why operators build trails. The question this article addresses is what happens to the returns once they do.
Vivid Sydney, read as an operating dataset
Vivid Sydney is the closest thing the sector has to a controlled experiment, because Destination NSW publishes detailed figures every year. Three numbers matter for anyone budgeting a trail.
First: attendance compounds faster than content does. In 2023 the festival drew 3.48 million attendees across 23 nights — a 35% increase on 2022 — and generated A$206.1 million in visitor expenditure, the highest in its 13-year history and 18% above the previous record set in 2019. The 2024 edition drew more than 2.5 million attendees and A$180 million, the second-highest spend on record. The 2022 edition is worth noting as a floor: run while travel was still constrained, it still drew 2.58 million attendees and A$119 million — 7.3% above the pre-pandemic 2019 event. Demand for after-dark experiences recovered ahead of the programming that served it, which is the opposite of how most operators plan.
Second: the spend is not spread across the footprint, it clusters around the icons. The 2023 festival ran an 8.5 km Light Walk with 57 installations. Yet 459,000 people attended the opening weekend alone, and 745,000 ate meals across the festival. Average stay was 3.3 nights, producing 756,135 room nights in Sydney. CBD hotel occupancy rose 12 percentage points against the prior year’s festival, reaching 78% overall and 90% on Friday and Saturday nights.
Operators do not travel for the median installation. They travel for the one they saw in a photograph, and then they eat, sleep and return.
Third — and this is the most useful number in the dataset — extending the programme added less than adding new territory. In 2016, Destination NSW extended the festival from 18 to 23 nights and opened three new precincts. Visitor expenditure reached A$110 million — up 75% on the previous year. Five extra nights alone would not have produced that. The new precincts gave people a second reason to come back and a second reason to stay overnight.
The lesson generalises: breadth of programme creates repeat visits, and repeat visits create the spend. A single long trail walked once does neither.
Why the anchor does the work
The mechanism is not mysterious, and it does not depend on the anchor being the biggest thing on site — only on it being the thing that cannot be seen anywhere else.
It sets the route. Visitors navigate to the piece they came for, then work backwards along the trail. If the anchor sits at the far end, the whole trail gets walked. If it sits at the entrance, visitors photograph it and leave. The single most common design error in night trails is placing the strongest piece first, because it converts a 90-minute experience into a 20-minute one.
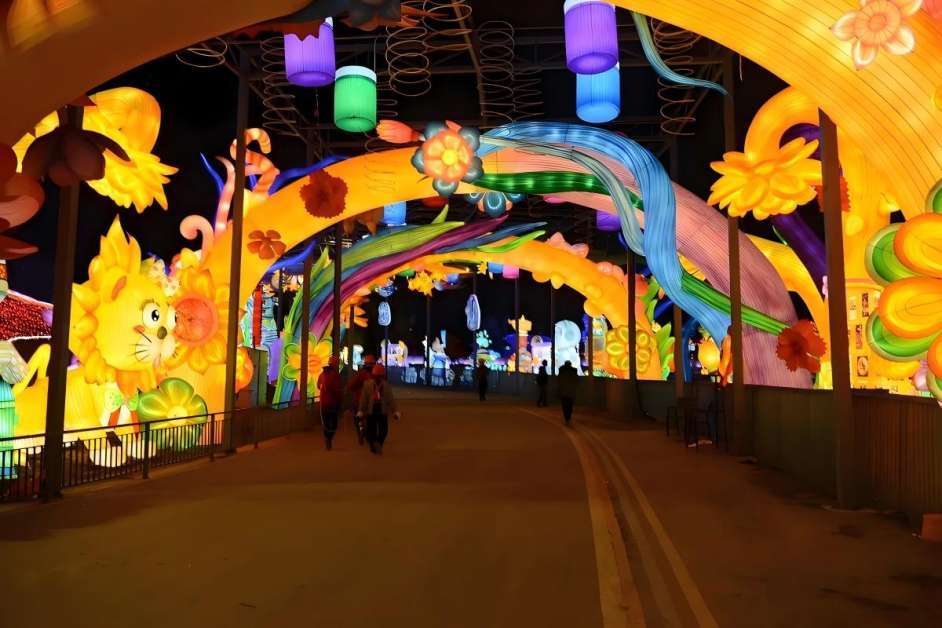
It sets the dwell time. The piece that pulls someone across a city also pulls them into the food and beverage offer, because they have now committed an evening rather than an hour. That is the mechanism behind 745,000 meals at Vivid, and behind CBD hotel occupancy climbing 12 points.
It sets the photography. Shareability is not a nice-to-have in this category; it is the acquisition channel. The anchor is the image that circulates, and the circulating image is what brings the next cohort of visitors. A trail of fifty competent pieces with no photographic centre produces almost no organic reach.
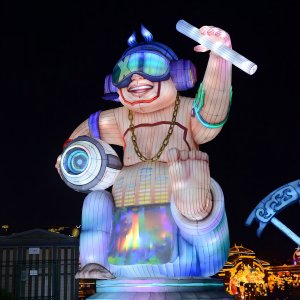
It sets the pricing conversation. An operator who can name the piece — and describe it in one sentence — has an asset they can sell to sponsors, package into a hotel bundle, and put on a poster. A schedule of custom lantern displays for themed attractions with no named centrepiece cannot be sold that way, however well each individual piece is made.
A simple model for sizing the anchor
Most operators cannot commission a Vivid-scale study, but they can borrow its ratios. Three relationships are worth applying before any budget is committed.
Spend per attendee. Vivid 2023 generated A$206.1 million across 3.48 million attendees — roughly A$59 per attendee. 2024 came in higher per head at approximately A$72, on lower attendance. Note what this figure includes: it is visitor expenditure across the destination, not ticket revenue. For a venue running a ticketed trail, the comparable measure is ticket plus on-site F&B plus retail per head, and the destination-wide number is the ceiling rather than the target.
Overnight conversion. Vivid’s 3.3-night average stay is the figure that turns an event into an economic development instrument. For a venue, the equivalent question is: what share of trail visitors arrive from more than 90 minutes away, and how many of them stay overnight? That share, multiplied by local room rates and ancillary spend, is usually where the return sits — not in the gate.
Anchor share of budget. The Vivid dataset does not publish a cost breakdown, but the attendance concentration is instructive: a festival with 57 installations is still marketed, photographed and remembered through perhaps five of them. A working rule for a first-time trail is to allocate a disproportionate share — commonly a third to a half of the installation budget — to two or three pieces, and treat the rest as connective tissue. If the trail cannot be described in one image, the allocation is wrong.
What this model deliberately does not do is predict a return percentage. Anyone offering a guaranteed uplift figure for a night trail is guessing; the variables — catchment, competition, season length, ticket price, existing F&B capacity — are too site-specific. The model’s purpose is to force the operator to name the anchor before signing the installation contract, because that naming is what makes the rest of the budget defensible.
Four decisions that determine whether the anchor works
Placement over size. The strongest piece should sit at roughly the two-thirds point of the intended route, not the start. This costs nothing and reliably extends dwell time. In practice it means specifying the giant lantern installations last rather than first: the route should be built around the piece, not the piece dropped onto a route that was already fixed.
One piece, one sentence. If the anchor cannot be described in a single line — “a 20-metre dragon whose head tracks visitors” — it will not be photographed, shared or sponsored. Complexity is the enemy of recall.
Structural, not just illuminated. Installations that depend entirely on lighting have nothing to show in daylight and nothing to photograph in bad weather. Pieces with real sculptural form work as a daytime landmark on the same footprint, which doubles the asset’s useful hours and strengthens the case for permanent rather than temporary installation.
Engineer for the site, not the catalogue. Wind load, anchoring, power distribution and evacuation routing are decided by the site, and retrofitting them after the design is fixed is where trail budgets go over. The engineering drawings should exist before the anchor is specified, not after.
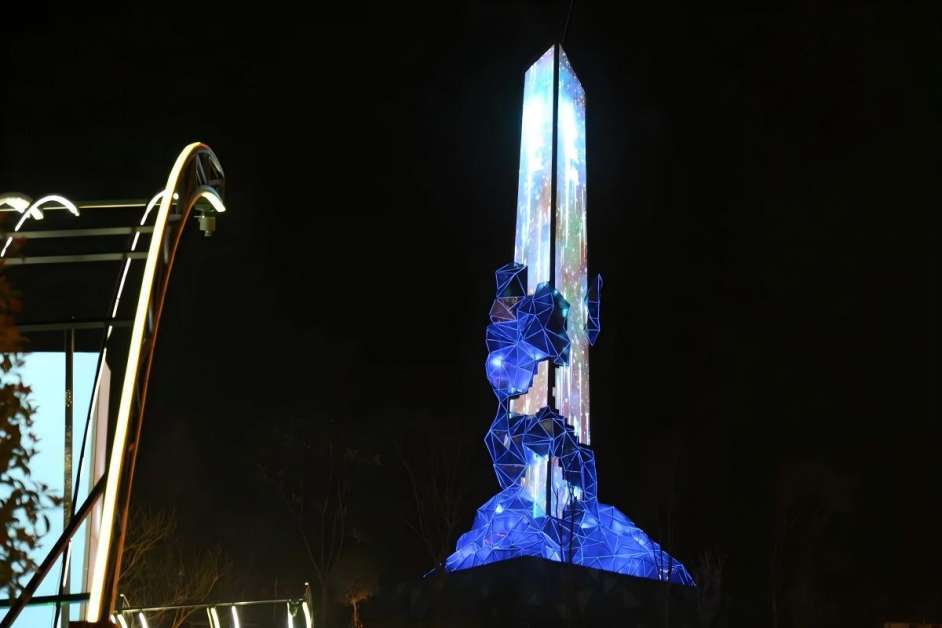
When the single-anchor approach fails
It is not a universal rule, and four conditions reliably break it.
When the site already has a landmark. A venue with an iconic structure — a heritage building, a bridge, a famous facade — already has its photograph. Competing with it wastes money; the trail should use it as the backdrop instead and spend the budget on the route and the transitions.
When the catchment is local and price-sensitive. The anchor economics depend on pulling people from far enough away to convert a visit into an evening, and an evening into a stay. In a market where 90% of visitors live within 20 minutes, there is no overnight spend to capture, and a five-figure centrepiece will not earn back its cost through ticket price alone. Smaller trails with strong narrative coherence outperform on those sites.
When circulation cannot absorb dwell. A site with a narrow access corridor, no F&B capacity, or a hard curfew cannot convert dwell time into revenue. The anchor will create a bottleneck rather than a return.
When the budget cannot buy a real anchor. The worst outcome is a mid-sized piece placed first and described as the centrepiece — expensive enough to consume the budget, not distinctive enough to be photographed. If the anchor budget is genuinely small, the better strategy is a shorter trail with one tightly themed zone, and no claim of a landmark.
The general principle survives all four cases: concentrate rather than distribute. What changes is what the concentration is spent on — a structure, a backdrop, a zone, or a narrative.
What this means for the next procurement cycle
The sector’s instinct — more installations, longer trails, denser programming — is a response to a real problem. Attendance is the constraint, and quantity feels like the safe answer.
The data points the other way. A trail with three pieces people travel for will outperform a trail with fifty they walk past, and it will do so at lower cost, with better photography, stronger sponsor inventory and a longer effective season. The operators who work this out first are not the ones with the biggest budget. They are the ones who decided, before anything was fabricated, which single piece their entire trail would be remembered by.
About the author
Zheng Hongfeng works on international outreach and the English-language site for Zigong Huilongtang Culture & Art Co., Ltd. (festivelanterns.com), a Zigong-based fabricator of large-scale illuminated installations for festivals, zoos, gardens and city events. This article is written independently of any commercial interest; all figures cited are from published government and academic sources.
Sources
Destination NSW Annual Report 2022–23 (NSW Parliament tabled paper); Destination NSW ministerial media releases, September 2016, November 2022 and 2025; London Nightlife Taskforce report (UCL Bartlett Centre for Advanced Spatial Analysis with the Greater London Authority), January 2026; Greater London Authority night-time economy figures.




Join us
Comments